

Image Details
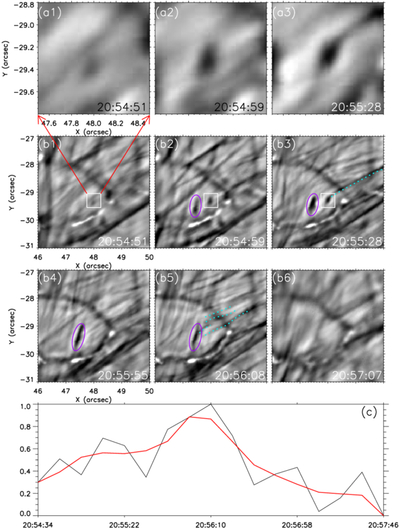
Caption: Figure 3.
Comparison between an individual spicule and an enhanced spicular activity. Panels ((a1)–(a3)) show magnified views of the white-boxed region in panels ((b1)–(b3)), which depicts the evolution of a microfilament with a length of only 0.23 Mm; the cyan dotted line in panel (b3) marks the individual spicule generated by its eruption. Panels ((b1)–(b6)) illustrate the evolution of a larger-scale microfilament marked by a purple ellipse, with the cyan dotted line in panel (b5) indicating a cluster of spicules (enhanced spicular activity) produced by the eruption. Panel (c) presents the normalized 171 Å intensity evolution over time within the region shown in panel (b1), where the black curve denotes the original data and the red curve represents the data smoothed over three time steps. An animation of the evolution of two nearby microfilament events is available from 20:54:51 to 20:57:07 UT. The duration of the animation is 2 s.
(An animation of this figure is available in the online article.)
(An animation of this figure is available.)
The video/animation of this figure is available in the online journal.
Other Images in This Article
Copyright and Terms & Conditions
© 2026. The Author(s). Published by the American Astronomical Society.

