

Image Details
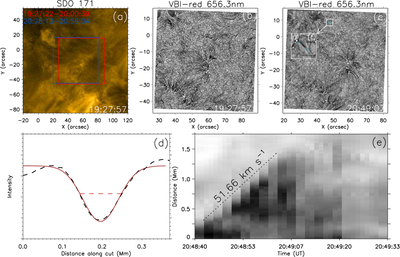
Caption: Figure 1.
Overview of the FOV and methodology for statistical analysis. Panel (a) shows a large-FOV 171 Å image. The red box and corresponding time interval denote the FOV of panel (b), while the blue box and corresponding time interval denote the FOV of panel (c). Panels (b)–(c) present Hα broadband images observed by DKIST/VBI-red. Panel (d) displays the intensity profile used to derive the width of a microfilament; the black dotted line represents the observed data, the red solid line shows a single Gaussian fit, and the red dashed line marks the position of the FWHM. Panel (e) displays a spacetime diagram obtained from a slice whose position in panel (c) is marked by the cyan line in the white box, and panel (f) shows a zoom-in of the white box. The black dotted line is utilized to estimate the plane-of-sky velocity.
Other Images in This Article
Copyright and Terms & Conditions
© 2026. The Author(s). Published by the American Astronomical Society.

