

Image Details
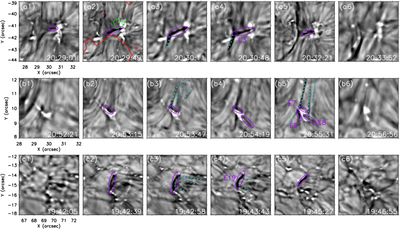
Caption: Figure 2.
Evolution of five microfilament eruptions. The locations of the microfilaments are marked by purple ellipses, and the spicules produced by the eruptions are denoted by cyan dotted lines. In panel (a2), the red contour represents +12 G and the green contour represents −12 G. An animation of the evolution of the three microfilament events is available from 19:42:05 to 20:56:56 UT. The duration of the animation is 4 s.
(An animation of this figure is available in the online article.)
(An animation of this figure is available.)
The video/animation of this figure is available in the online journal.
Other Images in This Article
Copyright and Terms & Conditions
© 2026. The Author(s). Published by the American Astronomical Society.

Copyright ©
2026 Astronomy Image Explorer. All Rights Reserved.
