

Image Details
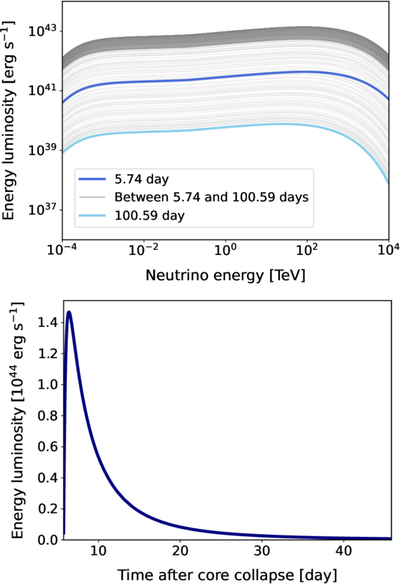
Caption: Figure 3.
Top: the neutrino spectral energy luminosity at different time slices, with the blue lines for the calculation boundaries and the gray ones for in-between times. The blue curves denote the onset and end of the neutrino calculation, t = 5.74 and 100.59 days after core collapse, respectively, while the gray curves show intermediate epochs. Bottom: the total energy luminosity of SN neutrinos as a function of days from the core collapse. Here, the sum of six neutrino flavors (﹩{\nu }_{e}+{\bar{\nu }}_{e}+{\nu }_{\mu }+{\bar{\nu }}_{\mu }+{\nu }_{\tau }+{\bar{\nu }}_{\tau }﹩) is shown in both panels.
Other Images in This Article
Copyright and Terms & Conditions
© 2026. The Author(s). Published by the American Astronomical Society.

Copyright ©
2026 Astronomy Image Explorer. All Rights Reserved.
