

Image Details
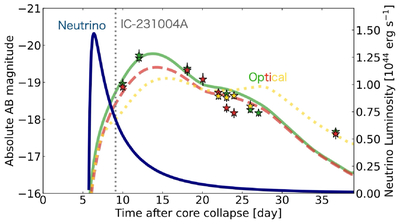
Caption: Figure 5.
Unified temporal picture of SN 2023uqf and IC-231004A. The colored curves and points show the optical light curves of SN 2023uqf (left axis; absolute AB magnitude), where the points are the ZTF measurements reported by R. Stein et al. (2025) and the curves are our STELLA-based optical model (Section 2). The blue curve shows the modeled neutrino luminosity evolution from the shock–CSM interaction phase (right axis; summed over flavors; Section 3). The vertical dotted line marks the detection time of IC-231004A. The explosion epoch inferred from the optical light-curve fit corresponds to Δt ≈ −10 days on this axis (Section 2.1), and the neutrino luminosity curve is shifted accordingly. In the low-count regime, the time dependence of the expected IceCube event rate provides a weighting for when a rare detection is most likely; IC-231004A occurs within the high-weight time window implied by the model.
Other Images in This Article
Copyright and Terms & Conditions
© 2026. The Author(s). Published by the American Astronomical Society.

