

Image Details
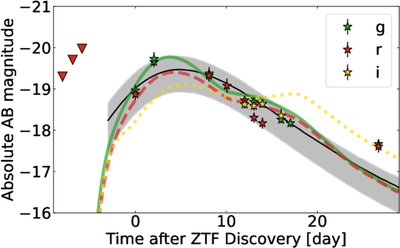
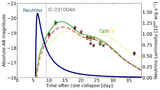
Caption: Figure 1.
Observed and synthesized optical light curves are shown. The shown points of g (green), r (red), and i (yellow) bands are taken from R. Stein et al. (2025). Star symbols mean detections, and downward triangles mean upper limits from nondetections. The solid green line, dashed red line, and dotted yellow line correspond to synthetic g-, r-, and i-band light curves, respectively. The synthesized light curves are shifted by Δt = −10 days relative to the “time after ZTF discovery” axis, corresponding to an inferred explosion epoch ∼10 days prior to the first ZTF detection. Gray regions correspond to the average light curve and 1.96σ error bars of 18 Type Ibn SNe from G. Hosseinzadeh et al. (2017). The average light curve is displayed with the x-axis shifted to align the peak positions.
Other Images in This Article
Copyright and Terms & Conditions
© 2026. The Author(s). Published by the American Astronomical Society.

