

Image Details
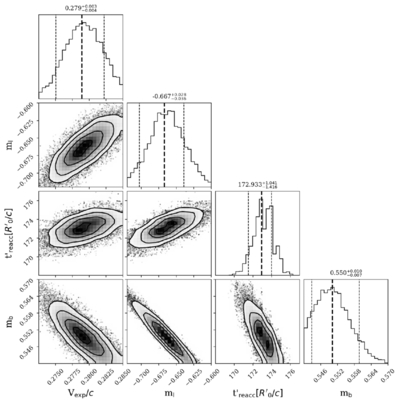
Caption: Figure 7.
Posterior distributions of the parameters described in Scenario C. The dashed lines in the one-dimensional histograms indicate the posterior median and the central 68% credible interval for each parameter, respectively.
Other Images in This Article
Copyright and Terms & Conditions
© 2026. The Author(s). Published by the American Astronomical Society.

Copyright ©
2026 Astronomy Image Explorer. All Rights Reserved.
