

Image Details
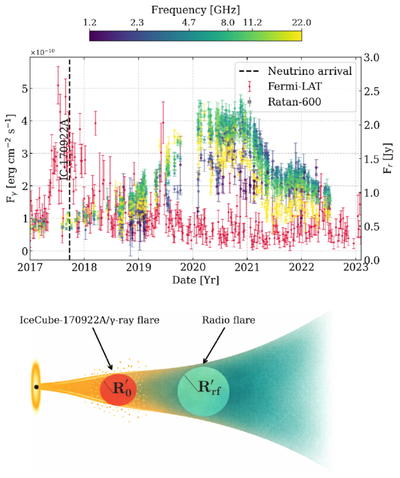
Caption: Figure 1.
Multiwavelength behavior and schematic model. Top panel: long-term light curve showing the weekly Fermi-LAT γ-ray flux from the Fermi-LAT Light Curve Repository (S. Abdollahi et al. 2023), based on the LAT likelihood analysis described therein together with the radio flux densities (the points are colored by observing frequency). The vertical dashed line marks the time of the high-energy neutrino arrival. Bottom panel: schematic of the expanding-blob model. A compact emitting region of initial radius ﹩{R}_{0}^{{\prime} }﹩ corresponding to the neutrino/γ-ray flare conditions inferred by A. Keivani et al. (2018) propagates along the jet and expands. The outer radius ﹩{R}_{{\rm{rf}}}^{{\prime} }﹩ corresponds to the optically thin radio-emitting stage constrained by RATAN-600 and MOJAVE observations.
Other Images in This Article
Copyright and Terms & Conditions
© 2026. The Author(s). Published by the American Astronomical Society.

