

Image Details
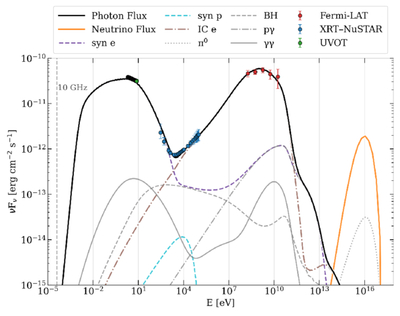
Caption: Figure 2.
SED at the neutrino epoch computed with LeHaMoC, using the (A. Keivani et al. 2018) LMBB2b leptohadronic solution. The different line styles represent different photon-production processes, the gray curves denote secondary/hadronic components, while the colored curves highlight the main leptonic contributions. The thick black solid line shows the overall photon spectrum, while the thick orange solid line shows the all-flavor neutrino spectrum.
Other Images in This Article
Copyright and Terms & Conditions
© 2026. The Author(s). Published by the American Astronomical Society.

Copyright ©
2026 Astronomy Image Explorer. All Rights Reserved.
