

Image Details
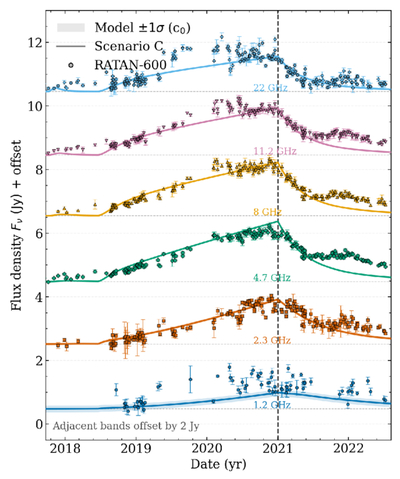
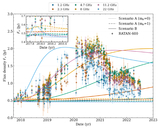
Caption: Figure 4.
Multifrequency RATAN-600 radio light curves of TXS 0506+056 at 1.2–22 GHz (markers with 1σ uncertainties), shown with vertical offsets of 2 Jy between adjacent bands for clarity. The solid curves correspond to Scenario C (redissipation followed by jet deceleration). The vertical dashed line marks the onset of the deceleration phase, after which the Doppler factor is assumed to decrease as a power law. For each band, the thin horizontal dashed line indicates the estimated quiescent/background level.
Other Images in This Article
Copyright and Terms & Conditions
© 2026. The Author(s). Published by the American Astronomical Society.

Copyright ©
2026 Astronomy Image Explorer. All Rights Reserved.
