

Image Details
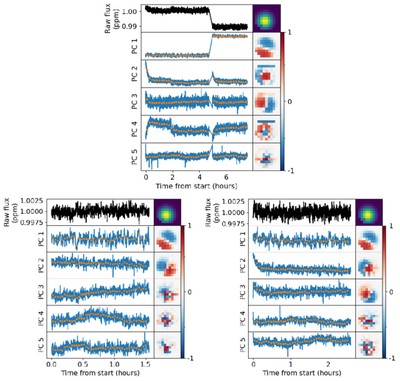
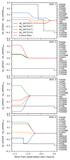
Caption: Figure 13.
The frame-normalized principal component eigenvalues (left column) and eigenimages (right column) compared to the raw light curve and point-spread function (top row) for visit 4. The top panel is the entire visit split across two observations when not trimming any data. The bottom panels are split across two observations and show the components used when fitting the light curve. The bottom left panel has the first 1500 integrations trimmed to remove the detector-settling slope and a suspected tilt event. No data are trimmed from the bottom right panel, as the beginning of the observation is near the expected time of eclipse.
Other Images in This Article
Show More
Copyright and Terms & Conditions
© 2026. The Author(s). Published by the American Astronomical Society.

