

Image Details
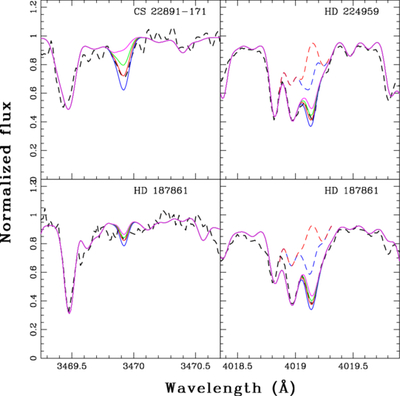
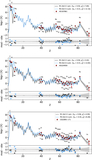
Caption: Figure 3.
Spectral fitting of the Th II lines at 3469.92 Å (left panel) and 4019.13 Å (right panel) is shown for the CEMP-rs stars HD 187861, HD 224959, and CS 22891-171. Red lines correspond to spectral syntheses with the adopted Th II abundances of −0.65 for CS 22891-171 and −0.70 for HD 187861 in the left panels, and −0.85 dex for HD 187861 and −0.95 dex for HD 224959 in the right panels. Blue and green lines correspond to syntheses with abundances deviating by ±0.3 dex from the adopted abundance. The black dashed line represents the observed spectrum. The magenta line corresponds to the synthesis with a null Th abundance. The blue dashed line represents the synthetic spectrum excluding 13CH contributions, while the red dashed line excludes both 13CH and Th II contributions.
Other Images in This Article
Copyright and Terms & Conditions
© 2026. The Author(s). Published by the American Astronomical Society.

