

Image Details
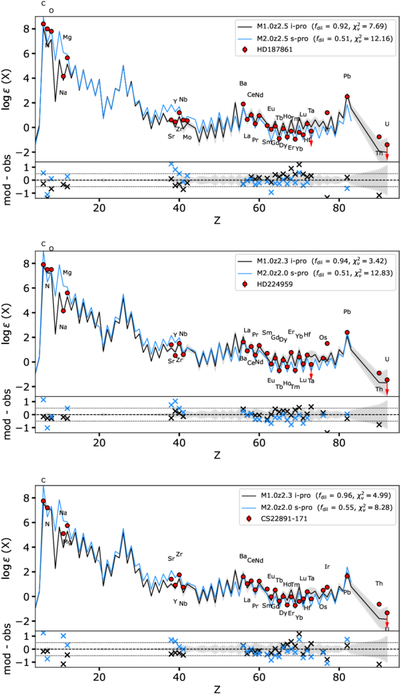
Caption: Figure 5.
The abundance patterns of the three CEMP-rs stars are compared with nucleosynthesis predictions from the STAREVOL code. The measured abundances are indicated by red circles. Upper limits are indicated with downward arrows. In all cases, the best-fitting theoretical predictions for both the i-process (black) and s-process (blue) are displayed. The gray shaded area corresponds to the typical i-process nuclear parameter uncertainties computed in S. Martinet et al. (2024) and based on a 1 M⊙, [Fe/H] = − 2.5 model.
Other Images in This Article
Copyright and Terms & Conditions
© 2026. The Author(s). Published by the American Astronomical Society.

Copyright ©
2026 Astronomy Image Explorer. All Rights Reserved.
