

Image Details
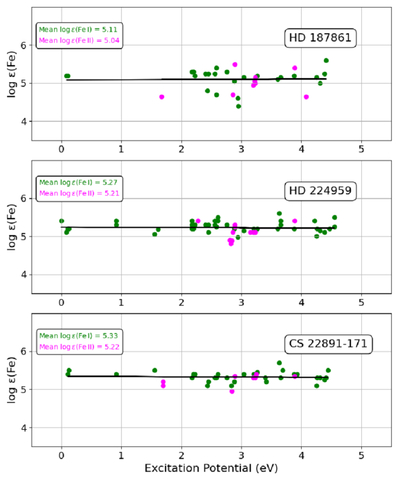
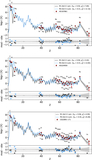
Caption: Figure 1.
Abundance vs excitation potential of Fe lines for the stars HD 187861, HD 224959, and CS 22891-171 (from top to bottom). Green and magenta circles represent Fe I and Fe II abundances, respectively. The straight line indicates the linear fit to the data.
Other Images in This Article
Copyright and Terms & Conditions
© 2026. The Author(s). Published by the American Astronomical Society.

Copyright ©
2026 Astronomy Image Explorer. All Rights Reserved.
