Image Details
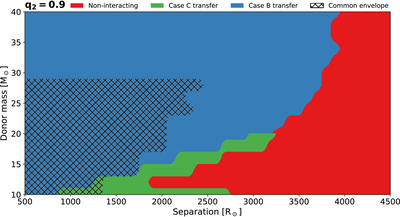
Caption: Figure 2.
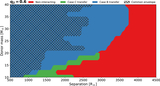
Binary interaction outcomes—noninteracting (red), Case C transfer (green), and Case B transfer (blue)—as a function of initial orbital separation and donor mass M1, assuming a fixed mass ratio q2 of 0.9. Hatched regions indicate models that undergo CEE. The boundary between interacting and noninteracting binaries shifts to larger separations with increasing total binary mass. A complex interaction landscape emerges at M1 ≲ 20, M⊙ and separations ≲3200 R⊙, where multiple interaction channels coexist. CEE occurs predominantly for M1 ≲ 28 M⊙ and separations ≲2500 R⊙.
Other Images in This Article
Copyright and Terms & Conditions
© 2026. The Author(s). Published by the American Astronomical Society.
Copyright ©
2026 Astronomy Image Explorer. All Rights Reserved.