Image Details
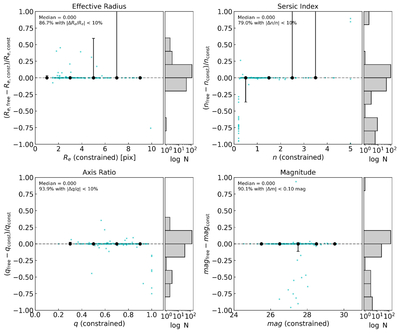
Caption: Figure 4.
Comparison between structural parameters obtained from unconstrained and constrained GALFIT modeling. The panels show the fractional differences in effective radius (Re), Sérsic index (n), and axis ratio (q), together with the absolute magnitude difference, as a function of the corresponding parameter derived from the constrained fits. Cyan points represent individual galaxies, while the black symbols indicate binned median values. The histograms on the right show the distributions of the parameter differences. The percentages reported in each panel indicate the fraction of galaxies for which the constrained and unconstrained measurements agree within 10% (or 0.1 mag for the magnitude). The errorbars represent 16th and 84th percentile errors on the median.
Other Images in This Article

Copyright and Terms & Conditions
© 2026. The Author(s). Published by the American Astronomical Society.