Image Details
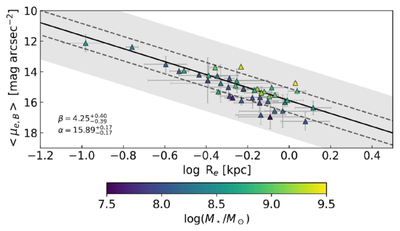
Caption: Figure 3.
The Kormendy relation for the Sample 1 (n > 1.5) galaxies color-coded by stellar mass. The solid black line shows the best-fitting relation, while the dashed and shaded regions denote the corresponding 1σ and 3σ scatter, respectively. The errorbars denote 1σ errors.
Other Images in This Article

Copyright and Terms & Conditions
© 2026. The Author(s). Published by the American Astronomical Society.
Copyright ©
2026 Astronomy Image Explorer. All Rights Reserved.