Image Details
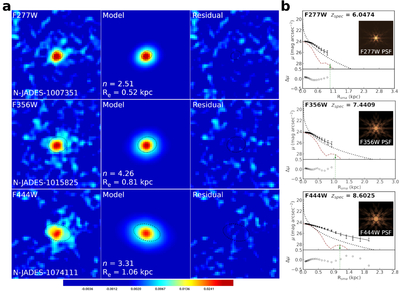
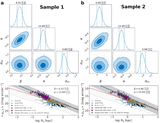
Caption: Figure 1.
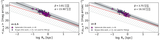
(a) False-color images of a few z ≥ 6 galaxies from our sample that are best fit with a single Sérsic model. For each galaxy, we present the JWST image sampling the rest-frame optical B band, the best-fit model, and the residual image in the first, second, and third column, respectively. The black dotted ellipse represents the effective radius (Re) of the model. (b) The 1D surface-brightness profiles of the galaxies. We present the best-fit surface-brightness model profiles (and intrinsic profiles) using solid (and dotted) curves. We show the corresponding residual profiles in the bottom panel of each plot. The green inverted arrow marks the 80% light-enclosing radius of the corresponding JWST PSF (shown by the brown dashed curve). We show the PSF of the respective JWST filter in the inset, with the 80% enclosed-flux aperture indicated by a green circle. The spectroscopic redshifts of the galaxies are listed at the top of these panels.
Other Images in This Article
Copyright and Terms & Conditions
© 2026. The Author(s). Published by the American Astronomical Society.