Image Details
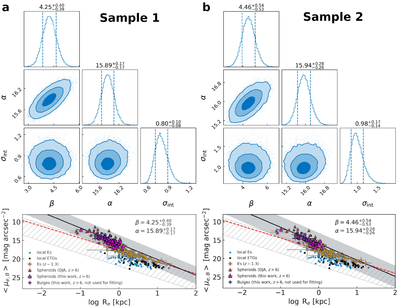
Caption: Figure 2.
(a) Modeling of the KR for Sample 1 (n > 1.5). Top: the marginalized posterior distributions for the KR slope, β, zero-point, α, and intrinsic scatter, σint. The off-diagonal panels show the 2D joint distributions for the KR parameters, with the contours representing the 1σ, 2σ, and 3σ probability regions corresponding to a 2D Gaussian distribution. The diagonal panels show the corresponding 1D histograms, with the vertical lines marking the 16th and 84th percentiles around the median values quoted at the top. Bottom: the black solid curve with gray shaded region represent the best-fit relation with 3σ boundaries for spheroidal systems at z ≥ 6 in this work. Here, galaxies from other deep fields are also taken into account from the morphological catalog of Dawn JWST Archive (DJA; A. Genin et al. 2025). As the bulges in this work have n < 1.5 (BS25), we exclude them from the KR modeling but place them onto the plot for comparison. The local Es and ETGs are taken from A. W. Graham (2002), F. M. Reda et al. (2005), S. A. Khanday et al. (2022). The z ∼ 1.3 Es are taken from P. Saracco et al. (2017) and their best-fit relation is given by the red dashed curve. The gray hatched region represent local KR from S. A. Khanday et al. (2022) with 3σ boundaries. (b) Same as panel (a), but for Sample 2.
Other Images in This Article

Copyright and Terms & Conditions
© 2026. The Author(s). Published by the American Astronomical Society.