Image Details
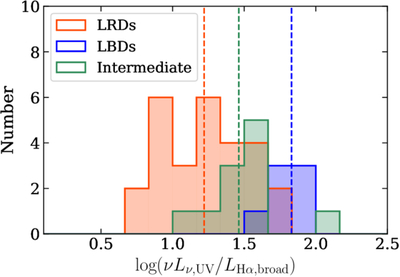
Caption: Figure 5.
Histograms of the UV-to-Hα luminosity ratios for the broad-line component in LRDs (red), LBDs (blue), and the intermediate-color population (green). The vertical dashed line denotes the median of each population.
Other Images in This Article
Copyright and Terms & Conditions
© 2026. The Author(s). Published by the American Astronomical Society.
Copyright ©
2026 Astronomy Image Explorer. All Rights Reserved.