Image Details
Caption: Figure 2.
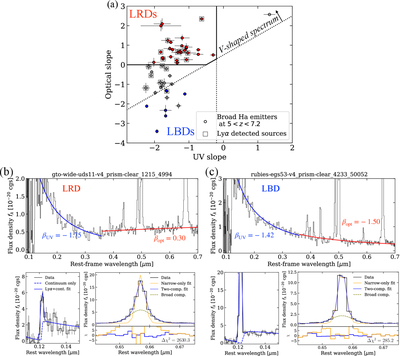
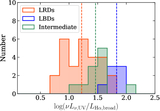
Sample selection in this work. (a) We select LRDs with V-shaped continua from spectroscopically confirmed broad Hα line emitters at 5 < zspec < 7.2 in the βopt–βUV diagram. Thick black lines define the color window for LRDs. As a control sample, we also select blue normal AGNs without the V-shaped continuum in this color–color diagram. (b) An example of sample LRDs taken as part of the GTO-Wide program (M. V. Maseda et al. 2024). The top panel presents the NIRSpec/Prism spectrum, and the bottom panel shows the Lyα (left) and Hα (right) line profile. For the Lyα line, the best-fit line profile is shown with the blue solid curve, while the continuum-only fit model is shown with the dashed curve. For the Hα line, the best-fit line profiles with narrow, unresolved component fits (orange) and broad+narrow component fits (blue) are shown, and the noise-normalized residual for each case is presented in the lower subpanel. (c) Same as panel (b) but for an example of the LBDs, taken as part of the RUBIES program (A. de Graaff et al. 2025b).
Other Images in This Article
Copyright and Terms & Conditions
© 2026. The Author(s). Published by the American Astronomical Society.