Image Details
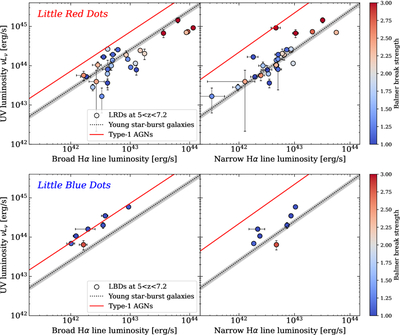
Caption: Figure 3.
Rest UV versus Hα line luminosity in LRDs (top) and LBDs (bottom). Broad and narrow components are displayed on the left and right, respectively. Plots are color-coded by the Balmer break strength, defined as fν,4230/fν,3560. As a reference, the UV-to-Hα luminosity ratios for young starburst galaxies (black dotted line) and typical type 1 AGNs (red solid line) are also shown. The gray shaded band shows the range of the luminosity ratio when the stellar age and gas density are varied for young SFGs.
Other Images in This Article
Copyright and Terms & Conditions
© 2026. The Author(s). Published by the American Astronomical Society.
Copyright ©
2026 Astronomy Image Explorer. All Rights Reserved.