Image Details
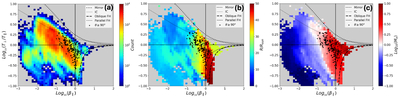
Caption: Figure 1.
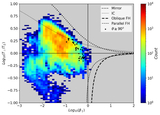
Scatterplot of magnetic deflection angles exceeding 90° in ﹩{\mathrm{log}}_{10}({T}_{\perp }/{T}_{\parallel })﹩ versus ﹩{\mathrm{log}}_{10}({\beta }_{\parallel })﹩ parameter space plotted on top of SW distributions color-coded by (a) counts per bin, (b) mean radial distance, and (c) mean ﹩{\mathrm{log}}_{10}({M}_{a})﹩. In all panels, the thresholds of the mirror and IC instabilities are shown in the thick and thin dotted lines, respectively. The thresholds of the oblique and parallel FH instabilities are shown in the thick and thin dashed lines, respectively. FOV-flagged intervals are retained in the main analysis (see the Appendix for the FOV-filtered distribution).
Other Images in This Article
Copyright and Terms & Conditions
© 2026. The Author(s). Published by the American Astronomical Society.