Image Details
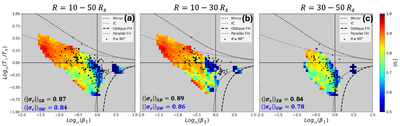
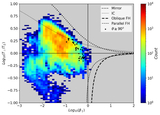
Caption: Figure 3.
Super-Alfvénic fast wind comparisons. Scatterplot of magnetic deflection angles exceeding 90° in ﹩{\mathrm{log}}_{10}({T}_{\perp }/{T}_{\parallel })﹩ versus ﹩{\mathrm{log}}_{10}({\beta }_{\parallel })﹩ parameter space plotted on top of reduced SW distributions color-coded by mean ∣σc∣ in the (a) R = 10–30 Rs and (b)R = 30–50 Rs range, where the distribution is limited to bins with at least 10 counts. In each panel, the thresholds of the mirror and IC instabilities are shown in the thick and thin dotted lines, respectively. The thresholds of the oblique and parallel FH instabilities are shown in the thick and thin dashed lines, respectively. In each panel, the mean absolute cross-helicity 〈∣σc∣〉 is indicated for SBs and SW.
Other Images in This Article
Copyright and Terms & Conditions
© 2026. The Author(s). Published by the American Astronomical Society.