Image Details
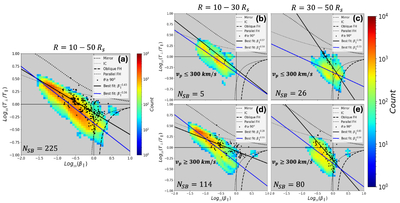
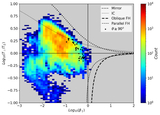
Caption: Figure 2.
Super-Alfvénic SB and SW distributions. Panel (a) shows a scatterplot of SBs in parameter space on top of the reduced (minimum of 10 counts per bin) SW distribution with the best linear fits for the SB distribution (black) and SW distribution (blue). Panels (b) and (c) show those populations corresponding to R = 10–30 Rs and R = 30–50 Rs, respectively, for vp≤ 300 km s−1, and panels (d) and (e) show the same for vp ≥ 300 km s−1. In each panel, the thresholds of the mirror and IC instabilities are shown in the thick and thin dotted lines, respectively. The thresholds of the oblique and parallel FH instabilities are shown in the thick and thin dashed lines, respectively. In each panel, the number of observed SBs (NSB) is indicated. Some SBs appear in regions of parameter space without SW data due to there being less than 10 counts per bin in those regions.
Other Images in This Article
Copyright and Terms & Conditions
© 2026. The Author(s). Published by the American Astronomical Society.