Image Details
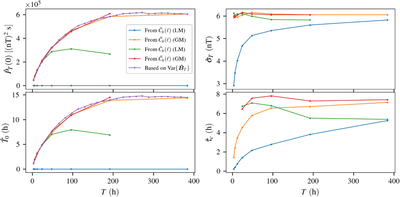
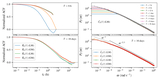
Caption: Figure 5.
Top left: the estimated PSD at zero frequency for each of the four ACF estimates, and the corresponding value obtained from Equations (16) and (21). Top right: the fluctuation variance obtained from the ACF value at τ = 0 for each T. Bottom left: the estimated ﹩{\hat{T}}_{0}﹩ obtained from Equation (21). Bottom right: the correlation timescale ﹩{\hat{\tau }}_{c}﹩ using the 1/e criterion for each ACF estimate. Note that for ﹩{\hat{C}}_{h}(\ell )﹩, there is no τc available at lower values of T where the ACF has not dropped to 1/e.
Other Images in This Article
Copyright and Terms & Conditions
© 2026. The Author(s). Published by the American Astronomical Society.
Copyright ©
2026 Astronomy Image Explorer. All Rights Reserved.