Image Details
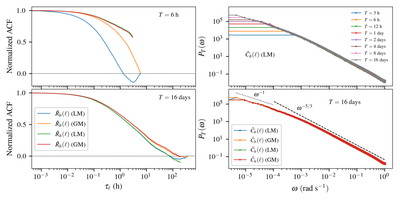
Caption: Figure 4.
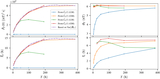
Left panels: comparison of biased vs. unbiased ACF estimates for T = 6 hr (top) and T = 16 days (bottom). Right panels: PSD for each ACF in Figure 2. The top panel shows the PSD obtained for each ACF estimate with interval lengths T from 3 hr to 16 days. The horizontal line in each PSD is artificially introduced to indicate the portion of the PSD not captured for each ﹩T﹩, below the frequency resolution ﹩\delta \omega =2\pi /T﹩. The bottom panel shows the PSD obtained from all ACF estimated with T = 16 days.
Other Images in This Article
Copyright and Terms & Conditions
© 2026. The Author(s). Published by the American Astronomical Society.
Copyright ©
2026 Astronomy Image Explorer. All Rights Reserved.