Image Details
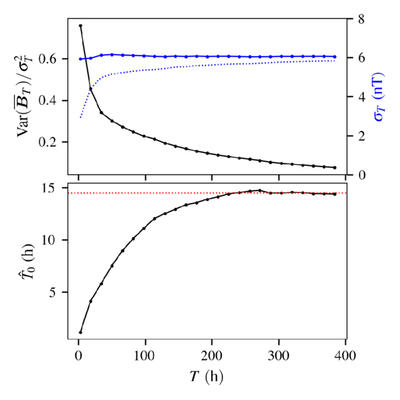
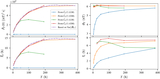
Caption: Figure 2.
Top: normalized local-mean-variance (left axis), ﹩{\rm{Var}}({\overline{{\boldsymbol{B}}}}_{T})/{\hat{\sigma }}_{T}^{2}﹩, and magnetic field variance (right axis), ﹩{\hat{\sigma }}_{T}^{2}﹩, calculated across 204 realizations for each time T of the ensemble. Bottom: estimated ﹩{\hat{T}}_{0}﹩ calculated for each ensemble of length T, saturating around ﹩{\hat{T}}_{0}\simeq 14.5\,\mathrm{hr}﹩.
Other Images in This Article
Copyright and Terms & Conditions
© 2026. The Author(s). Published by the American Astronomical Society.
Copyright ©
2026 Astronomy Image Explorer. All Rights Reserved.