

Image Details
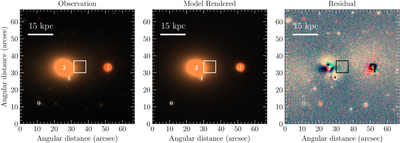
Caption: Figure 12.
Top: corner plot from the prospector fit, with the priors listed in Table 4. Bottom: median SED (blue) and sampled uncertainty (orange) for the host galaxy, with measured photometry plotted in black. The prospector model provides a good fit to the data across the full wavelength range, from the UV to MIR.
Other Images in This Article
Show More
Copyright and Terms & Conditions
© 2026. The Author(s). Published by the American Astronomical Society.

Copyright ©
2026 Astronomy Image Explorer. All Rights Reserved.
