

Image Details
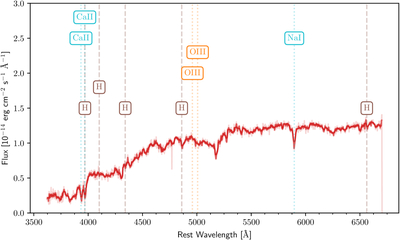
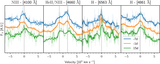
Caption: Figure 8.
Zoomed-in velocity plots for an assortment of lines in the GHTS spectra of TDE 2025abcr, with times given in observer frame relative to the peak date and the central wavelength given in square brackets. The blended He II (λ4686)/N III (λ4640) feature evolves over time, with the N III becoming more prominent. Each of these lines is marked by a vertical dashed line.
Other Images in This Article
Show More
Copyright and Terms & Conditions
© 2026. The Author(s). Published by the American Astronomical Society.

Copyright ©
2026 Astronomy Image Explorer. All Rights Reserved.
