Image Details
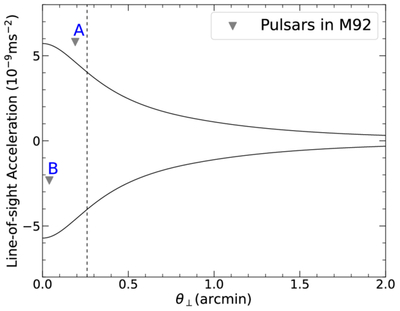
Caption: Figure 4.
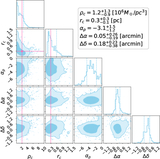
Acceleration model for M92. Black curves show the maximum and minimum LOS accelerations (aℓ,GC) predicted by the cluster potential as a function of projected offset (θ⊥). Downward triangles denote independent limits on pulsar accelerations (﹩{a}_{\ell ,P,{\rm{\max }}}﹩), and the vertical dashed line shows the core radius of M92 (﹩{r}_{{\rm{c}}}=0\mathop{.}\limits^{{\rm{^{\prime} }}}26﹩). The value of M92A is from Y. Lian et al. (2025).
Other Images in This Article
Copyright and Terms & Conditions
© 2026. The Author(s). Published by the American Astronomical Society.
Copyright ©
2026 Astronomy Image Explorer. All Rights Reserved.