Image Details
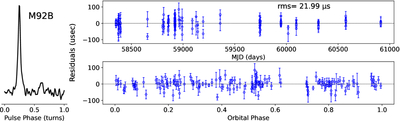
Caption: Figure 2.
Average pulse profile and timing residuals of M92B. The left panel shows the integrated pulse profile obtained by summing all 36 detections over 128 phase bins. The right panel shows the timing residuals versus MJD (top) and orbital phase (bottom) from the best-fit timing model.
Other Images in This Article
Copyright and Terms & Conditions
© 2026. The Author(s). Published by the American Astronomical Society.
Copyright ©
2026 Astronomy Image Explorer. All Rights Reserved.