Image Details
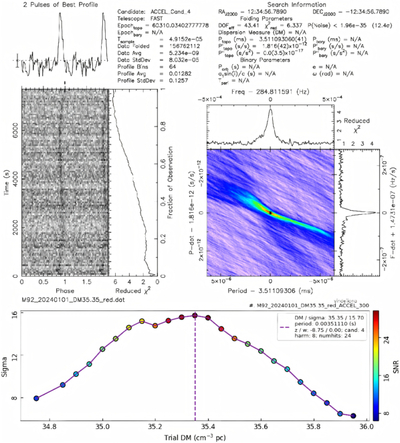
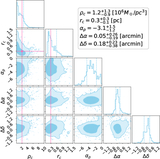
Caption: Figure 1.
Discovery plot of M92B. Top: folded pulse profile from the dedispersed time series produced using prepfold. Bottom: detection significance as a function of trial DM, peaking near the optimal value and decreasing due to dispersive smearing.
Other Images in This Article
Copyright and Terms & Conditions
© 2026. The Author(s). Published by the American Astronomical Society.
Copyright ©
2026 Astronomy Image Explorer. All Rights Reserved.