Image Details
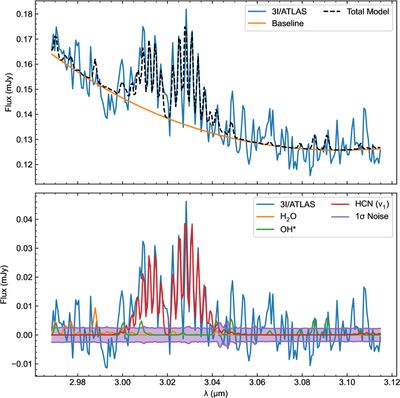
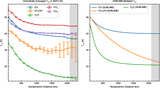
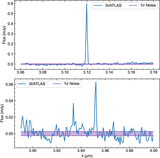
Caption: Figure 9.
Upper: 3I/ATLAS 3 μm spectrum with total molecular emission model and spectral baseline shown. Lower: baseline-subtracted spectrum with individual molecular models and the 1σ noise envelope overplotted.
Other Images in This Article
Copyright and Terms & Conditions
© 2026. The Author(s). Published by the American Astronomical Society.
Copyright ©
2026 Astronomy Image Explorer. All Rights Reserved.