Image Details
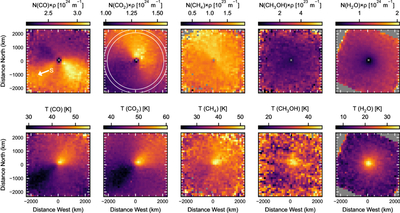
Caption: Figure 2.
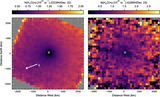
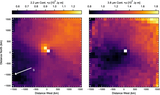
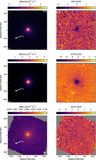
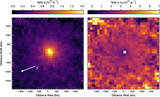
Upper panels: maps of N × ρ for CO, CO2, CH4, CH3OH, and H2O. The white arrow shows the projected direction of the Sun. The white annulus shows the region used to calculate representative Q. Note that the H2O map was derived from the 2.68 μm bands measured on December 22, whereas the remaining maps were constructed from the December 23 observations. Lower panels: maps of molecular rotational temperatures.
Other Images in This Article
Copyright and Terms & Conditions
© 2026. The Author(s). Published by the American Astronomical Society.
Copyright ©
2026 Astronomy Image Explorer. All Rights Reserved.