Image Details
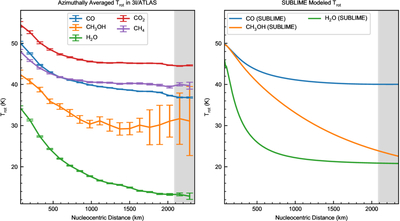
Caption: Figure 4.
Left: observed azimuthally averaged Trot for CO, CH3OH, H2O, CO2, and CH4. Right: modeled Trot as a function of nucleocentric distance for CO, CH3OH, and H2O using the SUBLIME radiative transfer code. The gray-shaded region shows the projected radial extent of the annulus from which representative Q’s were extracted for each molecule (Table 1). The x-axis extends to approximately the field of view of our spatial–spectral maps.
Other Images in This Article
Copyright and Terms & Conditions
© 2026. The Author(s). Published by the American Astronomical Society.
Copyright ©
2026 Astronomy Image Explorer. All Rights Reserved.