Image Details
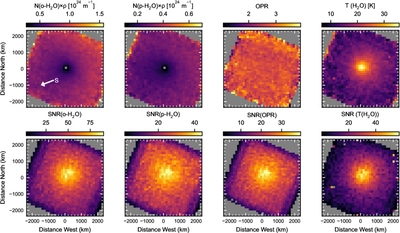
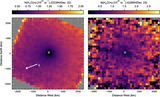
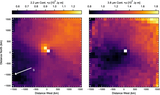
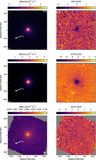
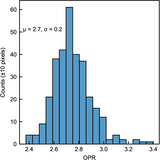
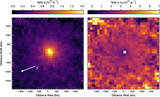
Caption: Figure 3.
Upper panels: maps of N × ρ for ortho-H2O and para-H2O, the derived OPR, and Trot(H2O) for the 2.68 μm band measured on December 22. Note that N for each species has been corrected for the derived OPR. Lower panels: signal-to-noise ratio (SNR) for each of the respective quantities in the upper panels.
Other Images in This Article
Copyright and Terms & Conditions
© 2026. The Author(s). Published by the American Astronomical Society.
Copyright ©
2026 Astronomy Image Explorer. All Rights Reserved.