Image Details
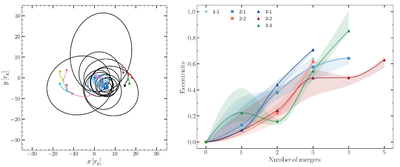
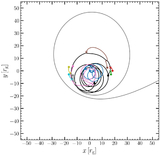
Caption: Figure 2.
(Left) Compact-object trajectories in the orbital xy-plane for the two-cluster simulation. Each colored track follows a compact object from its initial position, marked by a circle, to its last recorded position. Crosses mark tracks that terminate in mergers, while upward triangles mark the two remnants that survive to the final simulation time. Trajectories are shown in the inertial coordinate frame. (Right) Representative eccentricity histories for the merger lineages in the three runs, plotted against merger stage. The six series labeled 1–1, 2–1, 2–2, 3–1, 3–2, and 3–3 correspond to the tracked remnants in the one-, two-, and three-cluster configurations. Symbols mark the median orbital eccentricity measured after each merger event, the solid curves are smooth interpolants through those medians, and the shaded bands show the 1.5σ uncertainty percentile range within each window.
Other Images in This Article
Copyright and Terms & Conditions
© 2026. The Author(s). Published by the American Astronomical Society.