Image Details
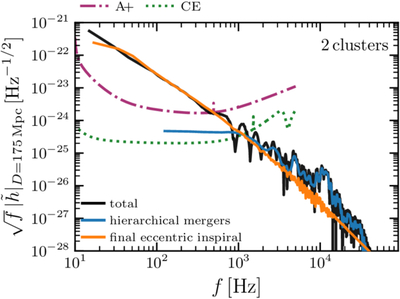
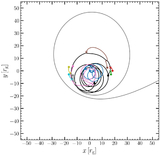
Caption: Figure 4.
Frequency-domain detector-frame gravitational-wave spectrum ﹩\sqrt{f}\,| \tilde{h}| ﹩ at D = 175 Mpc for the two-cluster simulation extracted at r = 80 rg. The black curve shows the full-signal spectrum, and the colored solid curves correspond to the hierarchical fragment merger and final merger with the central black hole, respectively. The split between these two windows is shown in Figure 3. The magenta and green curves show the LIGO A+ and Cosmic Explorer sensitivity amplitudes.
Other Images in This Article
Copyright and Terms & Conditions
© 2026. The Author(s). Published by the American Astronomical Society.
Copyright ©
2026 Astronomy Image Explorer. All Rights Reserved.