Image Details
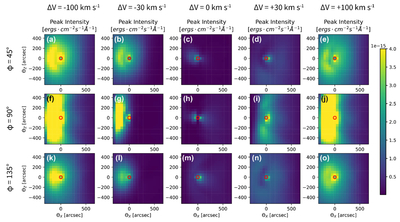
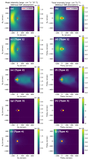
Caption: Figure 7.
Peak-intensity maps for lines of sight with different orientations and averaged ISM velocities. From top to bottom, the rows show results with ϕ = 45, 90, 135°, where ϕ is the angle between the upwind direction and the line of sight. From left to right, the columns show results with ΔV = −100, −30, 0, 30, 100 km s−1.
Other Images in This Article
Copyright and Terms & Conditions
© 2026. The Author(s). Published by the American Astronomical Society.
Copyright ©
2026 Astronomy Image Explorer. All Rights Reserved.