Image Details

Caption: Figure 4.
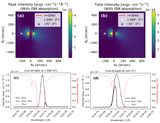
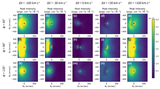
Modeled Lyα emission from the astrosphere. The left column shows the distribution of peak intensity, and the right column shows the emission intensity integrated over all wavelengths. The red circle represents the bottom boundary of the heliosphere model located at 30 au. The first row ((a), (b)) shows the combined emission from all four populations. Other rows show the separate contribution of neutral hydrogen ((c), (d)) generated downstream of the bow shock (Type 1); ((e), (f)) generated downstream of the termination shock (Type 2); ((g), (h)) generated in the supersonic stellar wind (Type 3); and ((i), (j)) originated from the ISM (Type 4).
Other Images in This Article
Copyright and Terms & Conditions
© 2026. The Author(s). Published by the American Astronomical Society.