Image Details
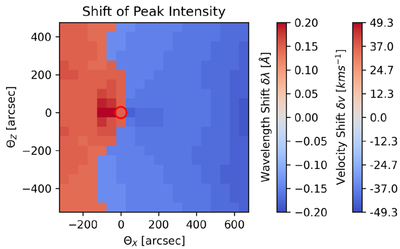
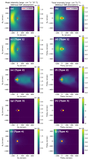
Caption: Figure 6.
Distribution of the peak positions in the emission spectra after ISM absorption. The positions are given as wavelength shifts δλ (left color bar) and the corresponding Doppler velocity shifts δv (right color bar).
Other Images in This Article
Copyright and Terms & Conditions
© 2026. The Author(s). Published by the American Astronomical Society.
Copyright ©
2026 Astronomy Image Explorer. All Rights Reserved.