Image Details
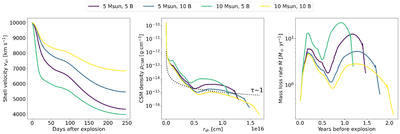
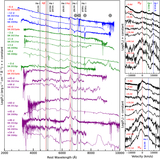
Caption: Figure 5.
CSM interaction models with different assumptions for ejecta masses and explosion energies. Left panel: evolution of the shell velocity. Middle panel: CSM density distribution reconstructed from bolometric light curve of SN 2022pda for different ejecta masses and explosion energies. The dotted line shows the rough estimate of CSM optical depth, ρ = 1/(κrsh) with a fiducial value of κ = 0.1 cm2 g−1 representing the scattering opacity of ionized H-poor CSM. Right panel: evolution of pre-explosion mass-loss rate under the assumption of constant CSM expansion velocity vCSM = 1900 km s−1.
Other Images in This Article
Copyright and Terms & Conditions
© 2026. The Author(s). Published by the American Astronomical Society.
Copyright ©
2026 Astronomy Image Explorer. All Rights Reserved.