Image Details
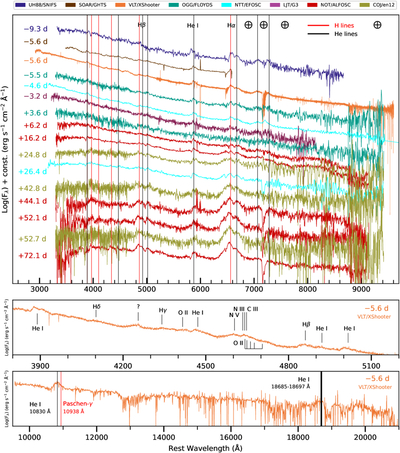
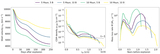
Caption: Figure 3.
Spectroscopic evolution of SN 2022pda. Top panel: sequence of optical spectra between phases −9.3 days and +72 days. Vertical lines mark the positions of the most prominent Balmer and He I lines. Middle panel: identification of the most prominent lines in the blue part (3800–5200 Å) of the Very Large Telescope (VLT)/X-Shooter spectrum obtained on 2022 September 29. Bottom panel: identification on the −5.6 day VLT/X-Shooter NIR spectrum. This spectrum has been binned to 20 Å to increase the signal-to-noise ratio (S/N). Reddening and redshift corrections have been applied in all spectra. The positions of most significant telluric bands are marked with the symbol ‘⊕’. Some lower S/N spectra are not shown in this figure, while they are listed in the Table 2 (Appendix A.3).
Other Images in This Article
Copyright and Terms & Conditions
© 2026. The Author(s). Published by the American Astronomical Society.