Image Details
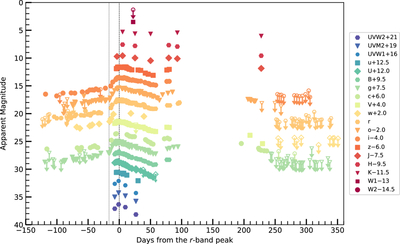
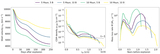
Caption: Figure 1.
Multiband light curves of SN 2022pda. The dotted vertical line indicates the estimated explosion epoch, while the dashed vertical line marks the epoch of the r-band light-curve peak. Upper limits are marked with downward-pointing arrows. Each light curve is shifted by an arbitrary constant indicated in the legend for clarity. The error bars representing the uncertainties in the photometric data, in most of cases, are smaller than the symbols. The phases are referred to the time of ﹩{r}_{{\rm{\max }}}﹩ (MJD = 59856.7).
Other Images in This Article
Copyright and Terms & Conditions
© 2026. The Author(s). Published by the American Astronomical Society.
Copyright ©
2026 Astronomy Image Explorer. All Rights Reserved.