Image Details
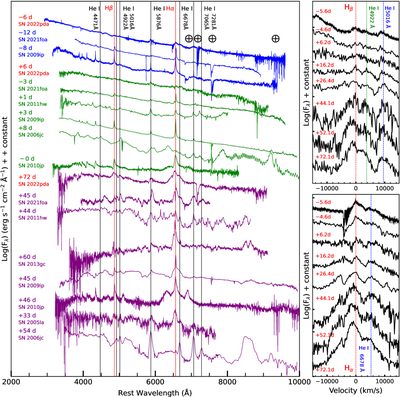
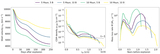
Caption: Figure 4.
Left panel: comparison of SN 2022pda spectra with those of reference objects at similar phases: before the light-curve peak (blue), around maximum (green), and at late times (purple). The most relevant lines (Hα , Hβ , and the main He I lines) are marked with vertical lines. The ‘⊕’ symbols mark the principal telluric absorption. Right panel: close up of the regions of Hα and Hβ of SN 2022pda spectra in velocity space. Hα , Hβ , and He I lines are highlighted by vertical lines.
Other Images in This Article
Copyright and Terms & Conditions
© 2026. The Author(s). Published by the American Astronomical Society.
Copyright ©
2026 Astronomy Image Explorer. All Rights Reserved.