Image Details
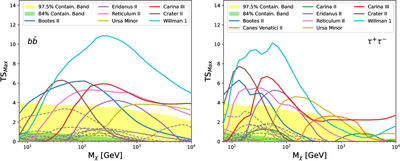
Caption: Figure A1.
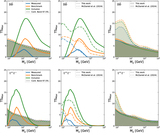
Maximum TS profiles for the individual dSphs as a function of Mχ across all cross-section values, for the ﹩b\bar{b}﹩ (left) and the τ+τ− (right) channels of annihilation. The yellow and green bands are, respectively, the 97.5% and 84% containment bands from the analysis of the individual blank fields.
Other Images in This Article
Copyright and Terms & Conditions
© 2026. The Author(s). Published by the American Astronomical Society.
Copyright ©
2026 Astronomy Image Explorer. All Rights Reserved.