Image Details
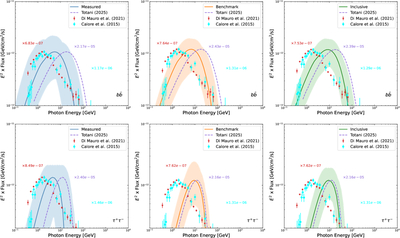
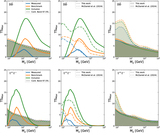
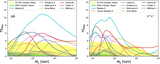
Caption: Figure 5.
Expected γ-ray emission from DM annihilation assuming the best-fit Mχ and 〈σv〉 for the Measured (left), Benchmark (center), and Inclusive (right) samples, assuming a dSph with the median J factor of each sample, in the ﹩b\bar{b}﹩ (top) and τ+τ− (bottom) channels of annihilation. The median J factors are ﹩{\mathrm{log}}_{10}{\bar{J}}_{M}=18.17﹩, ﹩{\mathrm{log}}_{10}{\bar{J}}_{B}=18.23﹩, and ﹩{\mathrm{log}}_{10}{\bar{J}}_{I}=18.23﹩ in the Measured, Benchmark, and Inclusive samples, respectively. The shaded regions are evaluated from the 1σ uncertainties on Mχ and 〈σv〉. The dashed purple line is a fit to the DM annihilation spectrum for the halo-like excess emission as presented in T. Totani (2025, see their Figure 16, second panel). The red and cyan data points is the GCE emission presented in M. Di Mauro & M. W. Winkler (2021) and F. Calore et al. (2015), respectively. The line from T. Totani (2025) and the data from M. Di Mauro & M. W. Winkler (2021) and F. Calore et al. (2015) are rescaled to match the expected dSph contribution in each panel at their peak, with the scaling factors reported on the plot in matching color.
Other Images in This Article
Copyright and Terms & Conditions
© 2026. The Author(s). Published by the American Astronomical Society.