Image Details
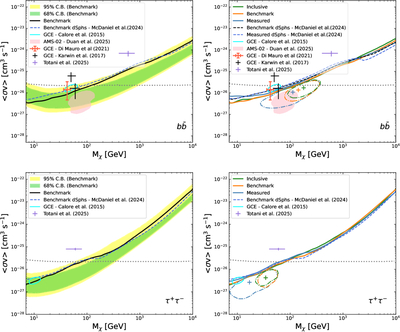
Caption: Figure 2.
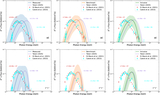
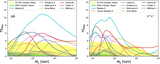
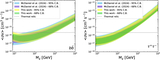
Left: upper limits for the cross section of annihilation as a function of the mass of the DM particle for the ﹩b\bar{b}﹩ (top) and τ+τ− (bottom) channels, for the Benchmark sample. The green and yellow bands are, respectively, the 68% and 95% containment bands obtained from the blank fields analysis. The dashed line represents the upper limits presented in A. McDaniel et al. (2024), while the red point, the black points, and the cyan contour refer to the mass and cross section implied by the GCE, as reported by M. Di Mauro & M. W. Winkler (2021), C. Karwin et al. (2017), and F. Calore et al. (2015), respectively. The purple point refers to the halo-like emission reported by T. Totani (2025). The pink shaded area represents the values derived from AMS-02 antiproton data. Right: upper limits for the cross section of annihilation as a function of the mass of the DM particle in the Measured (blue), Benchmark (orange), and Inclusive (green) dSph samples, in the ﹩b\bar{b}﹩ (top) and τ+τ− (bottom) channels. The dashed lines are the upper limits presented in A. McDaniel et al. (2024) for the Benchmark (black) and Measured (blue) samples. The points and dotted–dashed contours are the coordinates of the points of maximum significance from the combined TS profiles of the three samples of dSphs, and their 1σ local confidence level; see Section 6 for details. In all four panels, the dotted gray line is 〈σv〉 for thermal relic WIMP DM as a function of Mχ (G. Steigman et al. 2012).
Other Images in This Article
Copyright and Terms & Conditions
© 2026. The Author(s). Published by the American Astronomical Society.