

Image Details
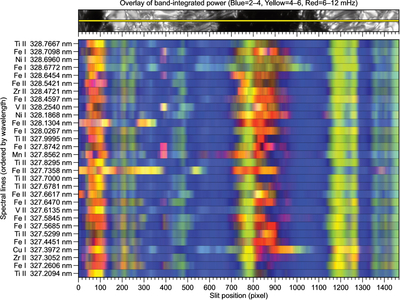
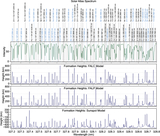
Caption: Figure 5.
Blue-yellow-red composite of the row-normalized band-integrated RGWS power along the slit, constructed from the same maps as shown in Figure 2. The three frequency bands are mapped to color channels as indicated in the legend above the figure. This composite is included only as a qualitative visual summary of the relative band balance along the slit; all quantitative interpretation in the main text is based on Figures 2 and 3.
Other Images in This Article
Copyright and Terms & Conditions
© 2026. The Author(s). Published by the American Astronomical Society.

Copyright ©
2026 Astronomy Image Explorer. All Rights Reserved.
